Getting started
Now that you freshly installed Gravity, you can see the following new panels in your Cytoscape interface:
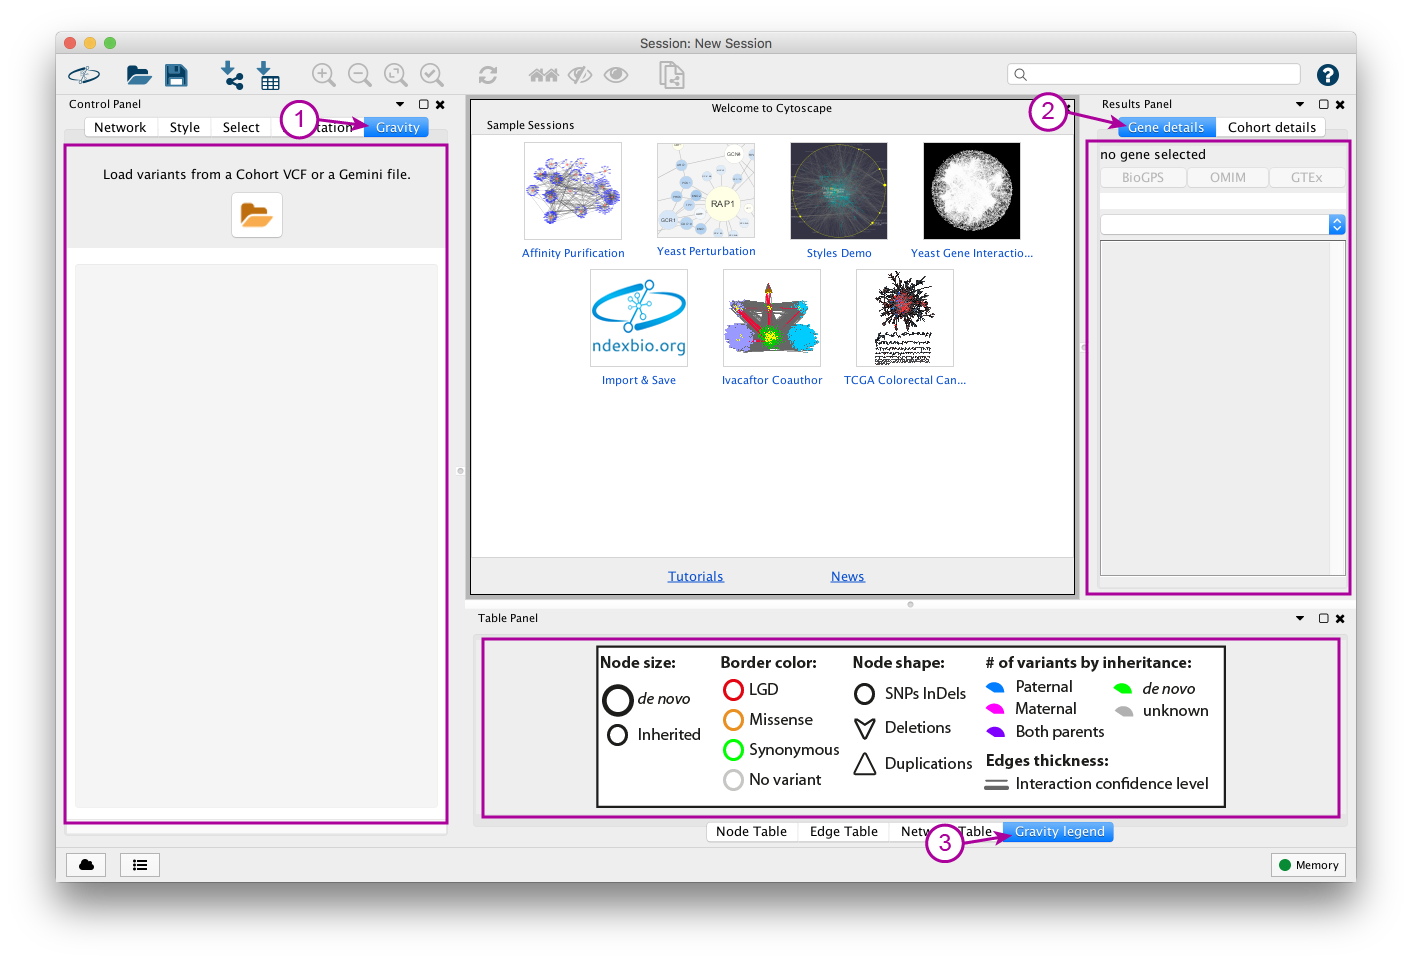
Cytoscape interface with Gravity’s panels highlighted.
- Panel 1 is the Control Panel. This is where you will be able to load data, select genesets and pathways, apply filters, etc.
- Panel 2 are the Results Panel. Splitted in two tabs, Gene details and Cohort details they will grant you additional informations on the displayed network, and more specifically on selected nodes.
- Panel 3 located in the Table Panel, will provide a legend to help you interpret the default color code used in Gravity’s networks.
Demo dataset
You can download the demo dataset we are using in this getting started there: CEU Trio NA12878
Next unzip the files, you should end-up with the 3 following files:
- CEU-Trio.vcf.gz
- CEU-Trio.vcf.gz.tbi
- CEU-Trio.vcf.gz.ped
Note
This is a vcf of the individual NA12878 with her parents annotated as follow:
- VEP for function analysis using GRCh37.p13 ensembl v91
- gnomAD exonic version 2.0.2
- CADD version 1.3
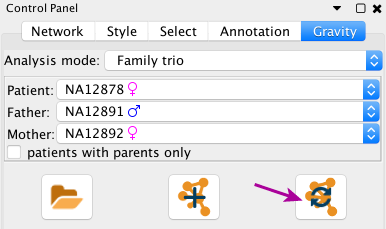
Loading a dataset
In Gravity’s Control Panel, click on the open icon and open the demo dataset CEU-Trio.vcf.gz.
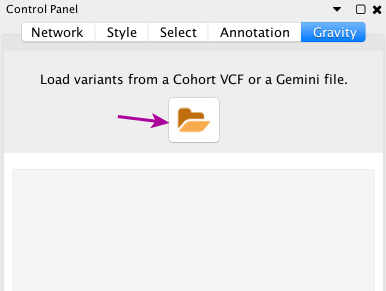
Opening a dataset in Gravity’s Control Panel
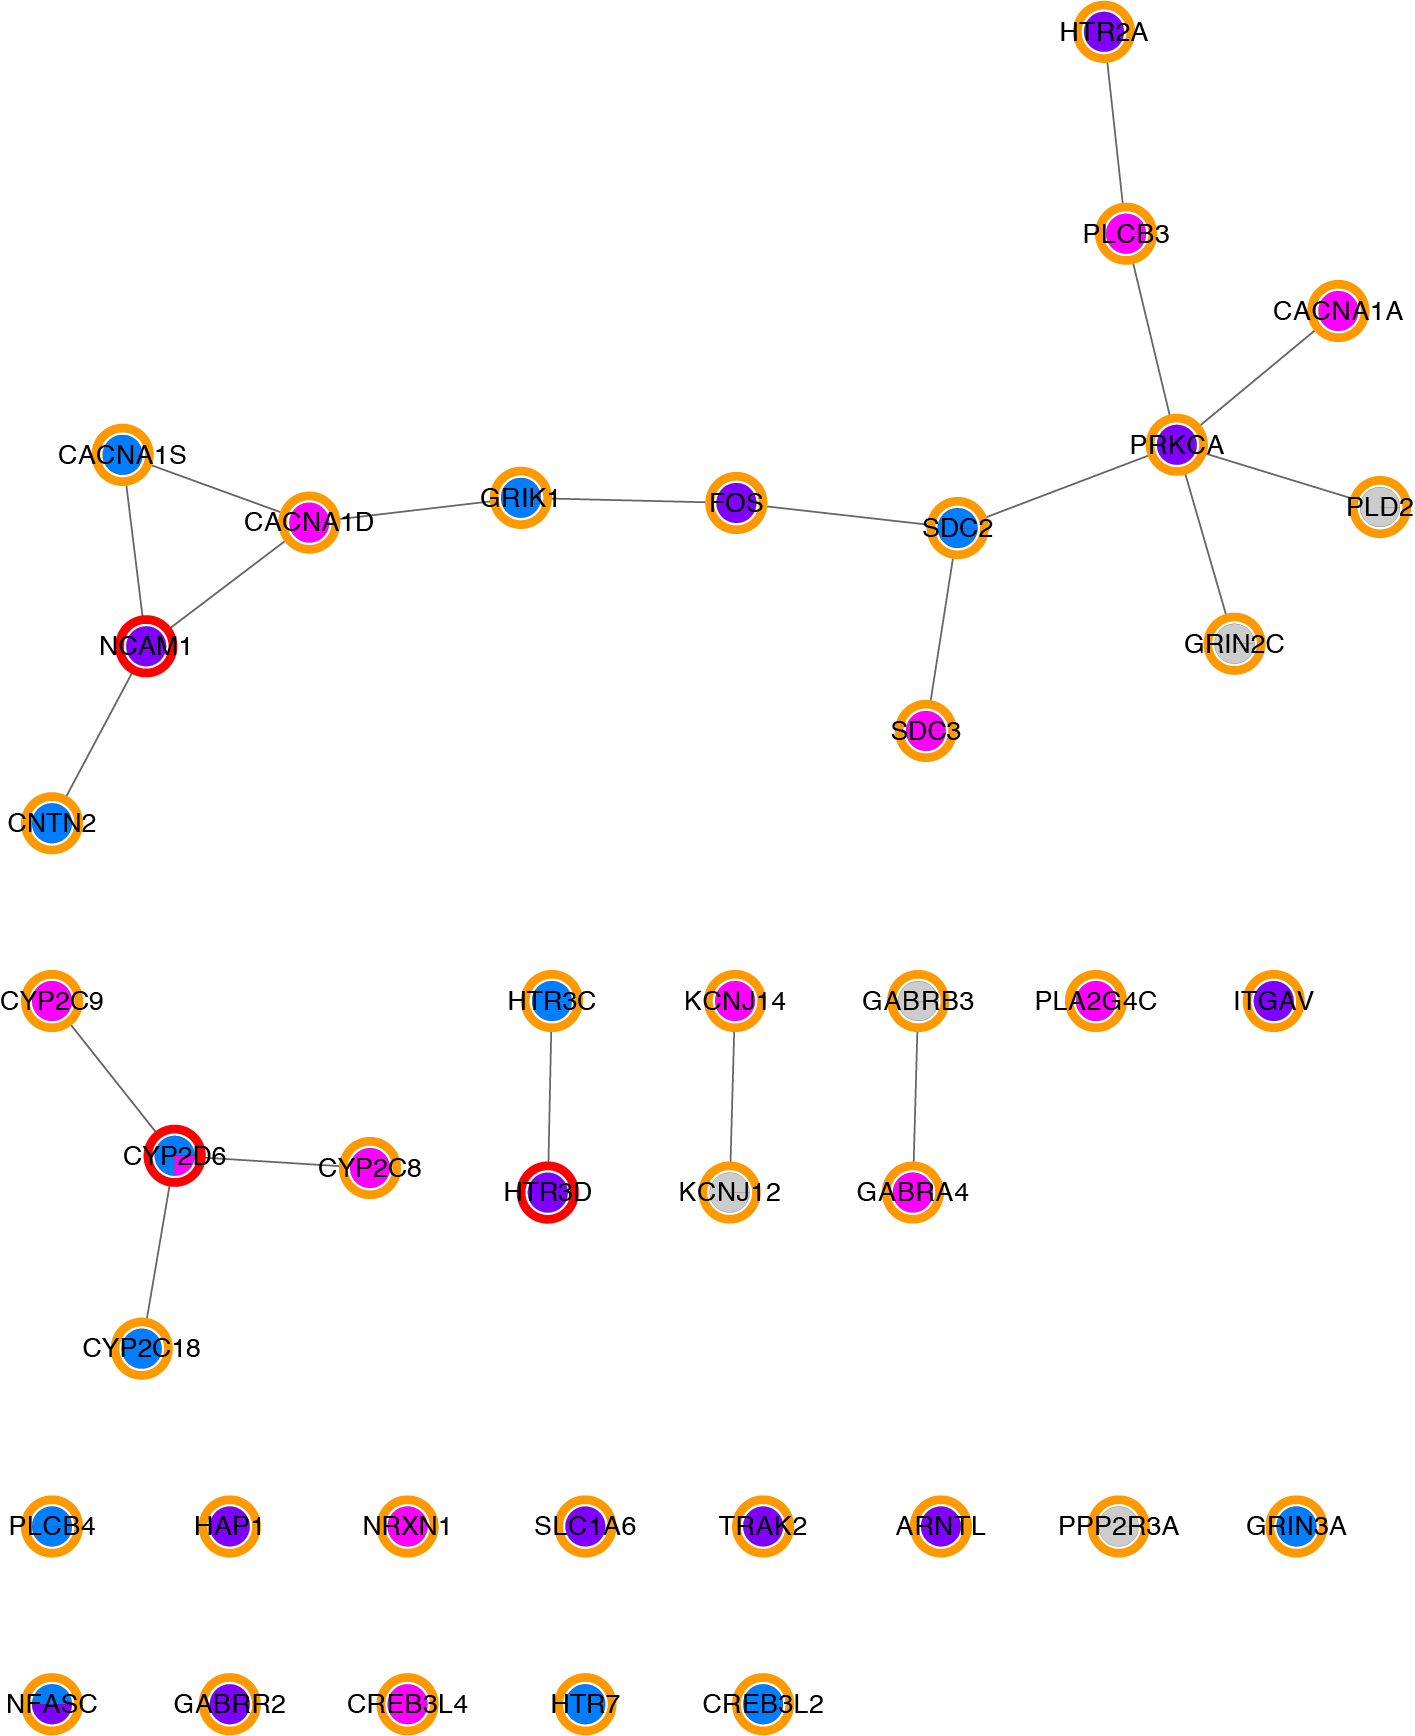
Visualising your first network
Once you loaded a dataset, the Control Panel gets updated to show new options. There you can directly click on the Create a new network button to display a first network.
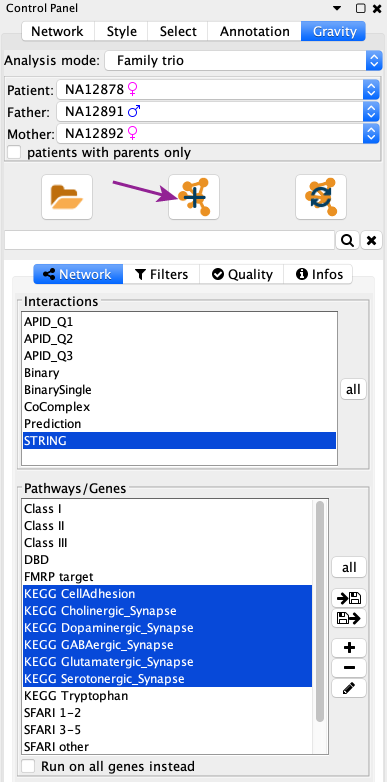
Create a new network from Gravity’s Control Panel
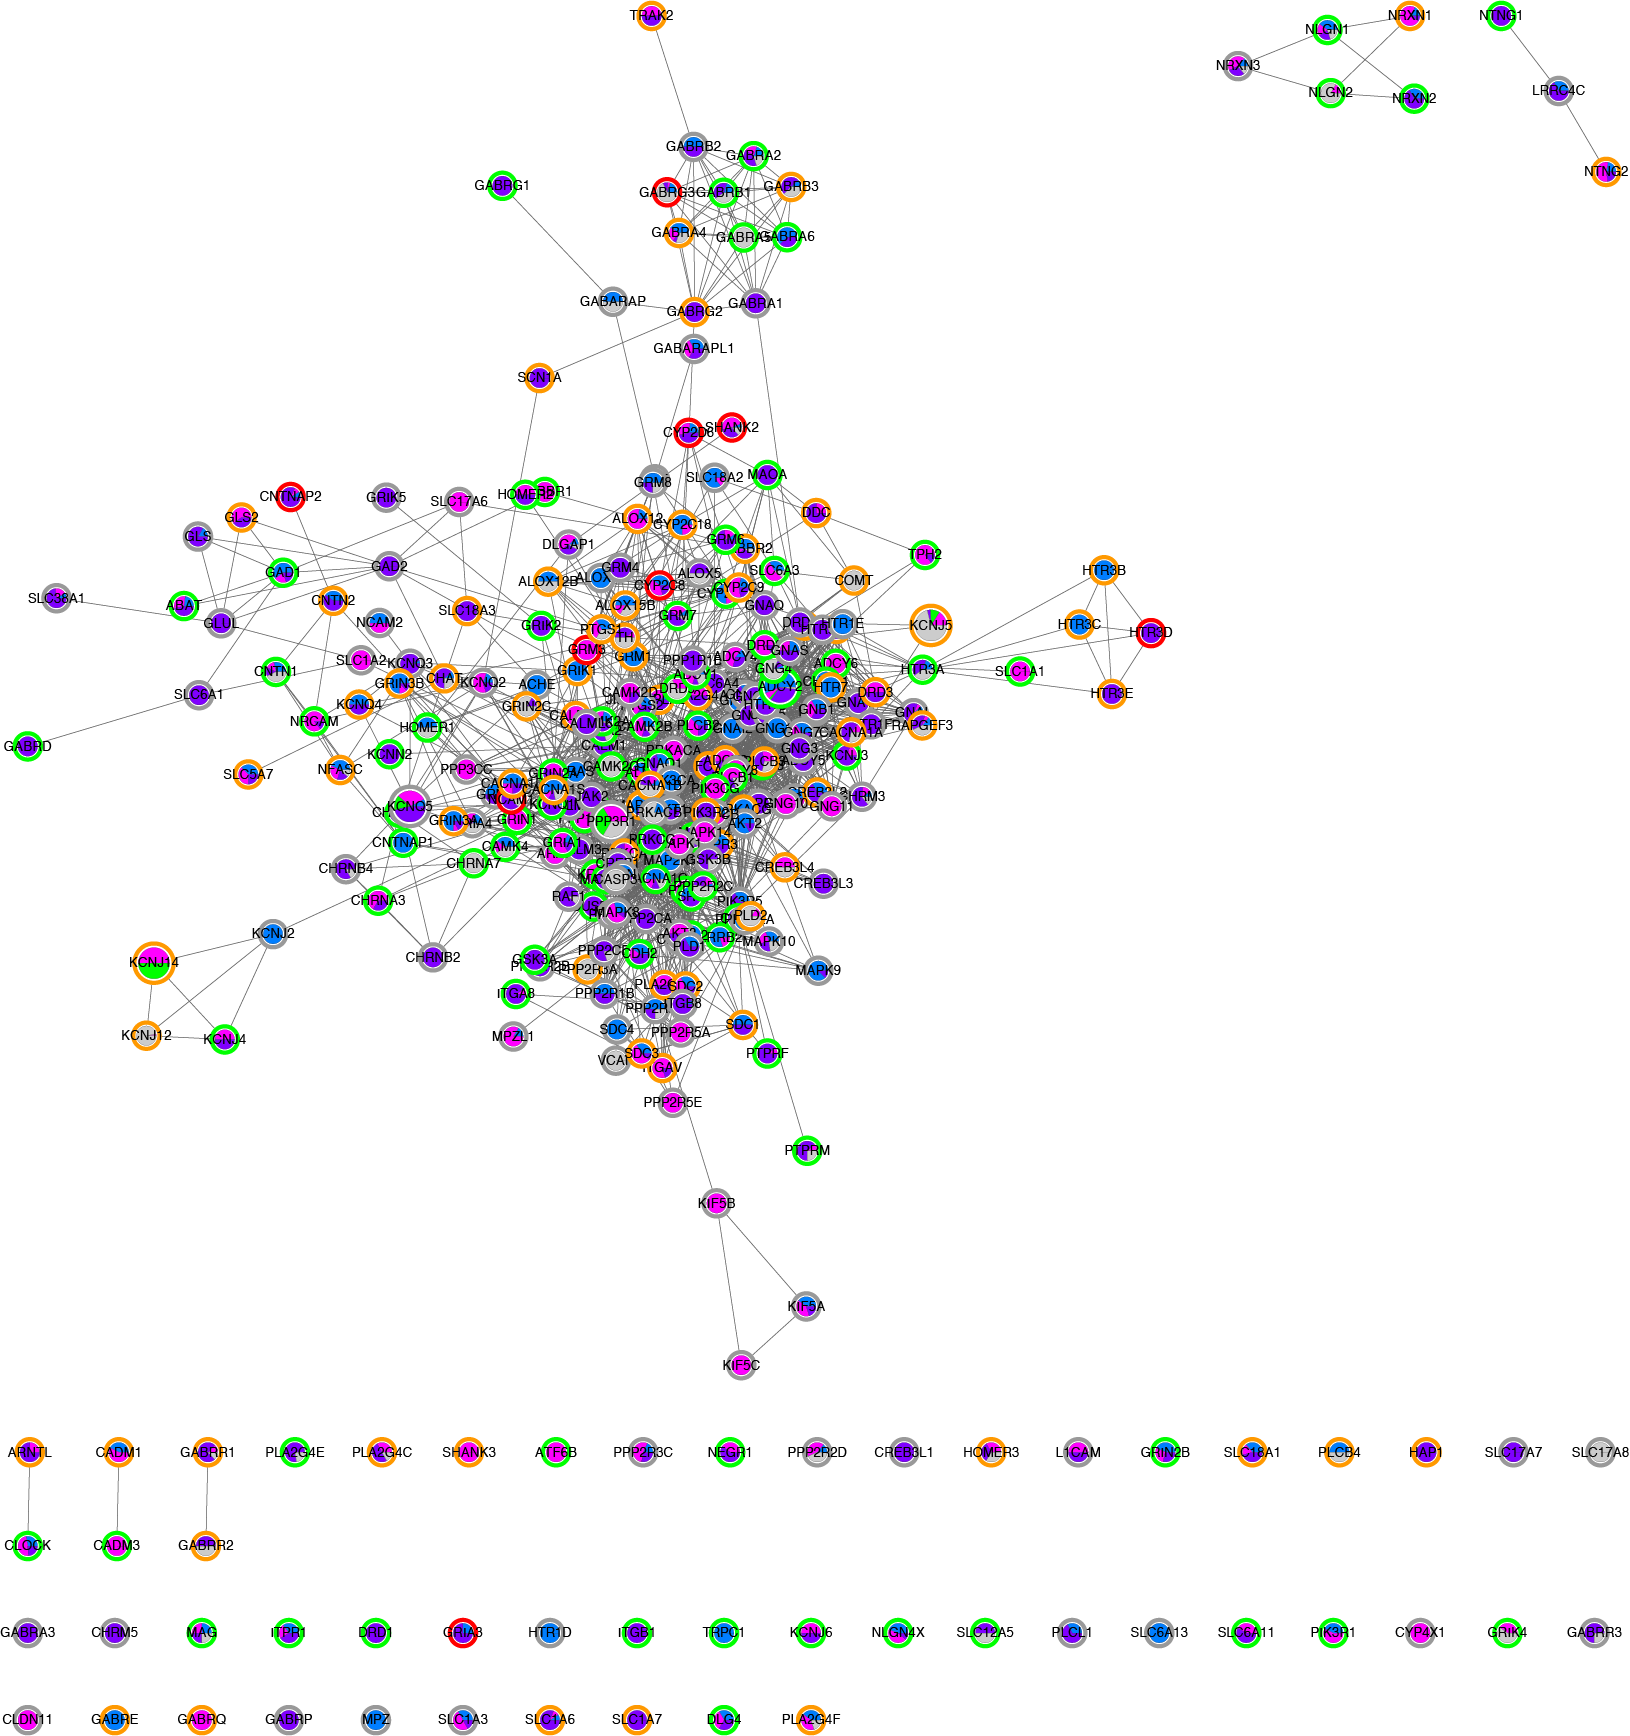
First network created. It shows all genes from the KEGG synaptic pathways (362 genes) that are mutated for the individual NA12878.
Among the tables is a tab displaying a legend helping to interpret the colour scheme used.
Note
We assume that you are using the default parameters provided in the current version of Gravity.
Filtering the data
This network contains a lot of variants, some of which might not be of interest for you, so now we are going to apply some filters on it.
- remove the synonymous variants
- filter out common variants using gnomAD frequency
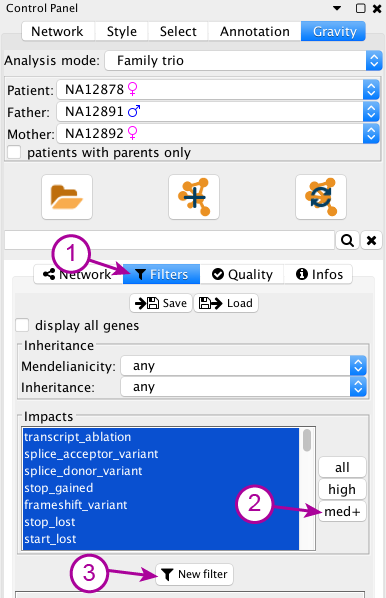
In Gravity’s control panel, select the Filters subpanel (1). In this subpanel, you can click on “MED+” (2) next to the Impacts list in order to only select elements of medium or higher impact in this list (Low here meaning synonymous and non coding). After this, click the “New filter” (3) button to create a new filter on other VCF data.
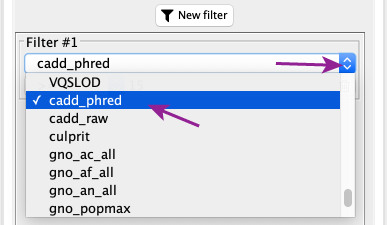
After clicking the “New filter” button, in this newly appeared filter, use the scrolldown menu to select “cadd_phred” which correspond in our demo dataset to the CADD score.
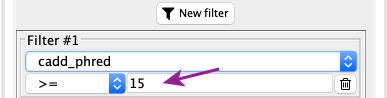
After selecting the right field in the list, you need to enter the value to use as a threshold, here we will be using 15. You also need to double check the comparison operator, here “>=” in order to keep variants with a cadd_phred greater or equal to 15
You can then update the current network.
Filtered network, without synonymous and non-coding variant, and with only rare variants(with CADD greater than 15).
Gene details
Once you obtained a network with interesting genes for you, you can select one, for instance here CACNA1D, by clicking on it.
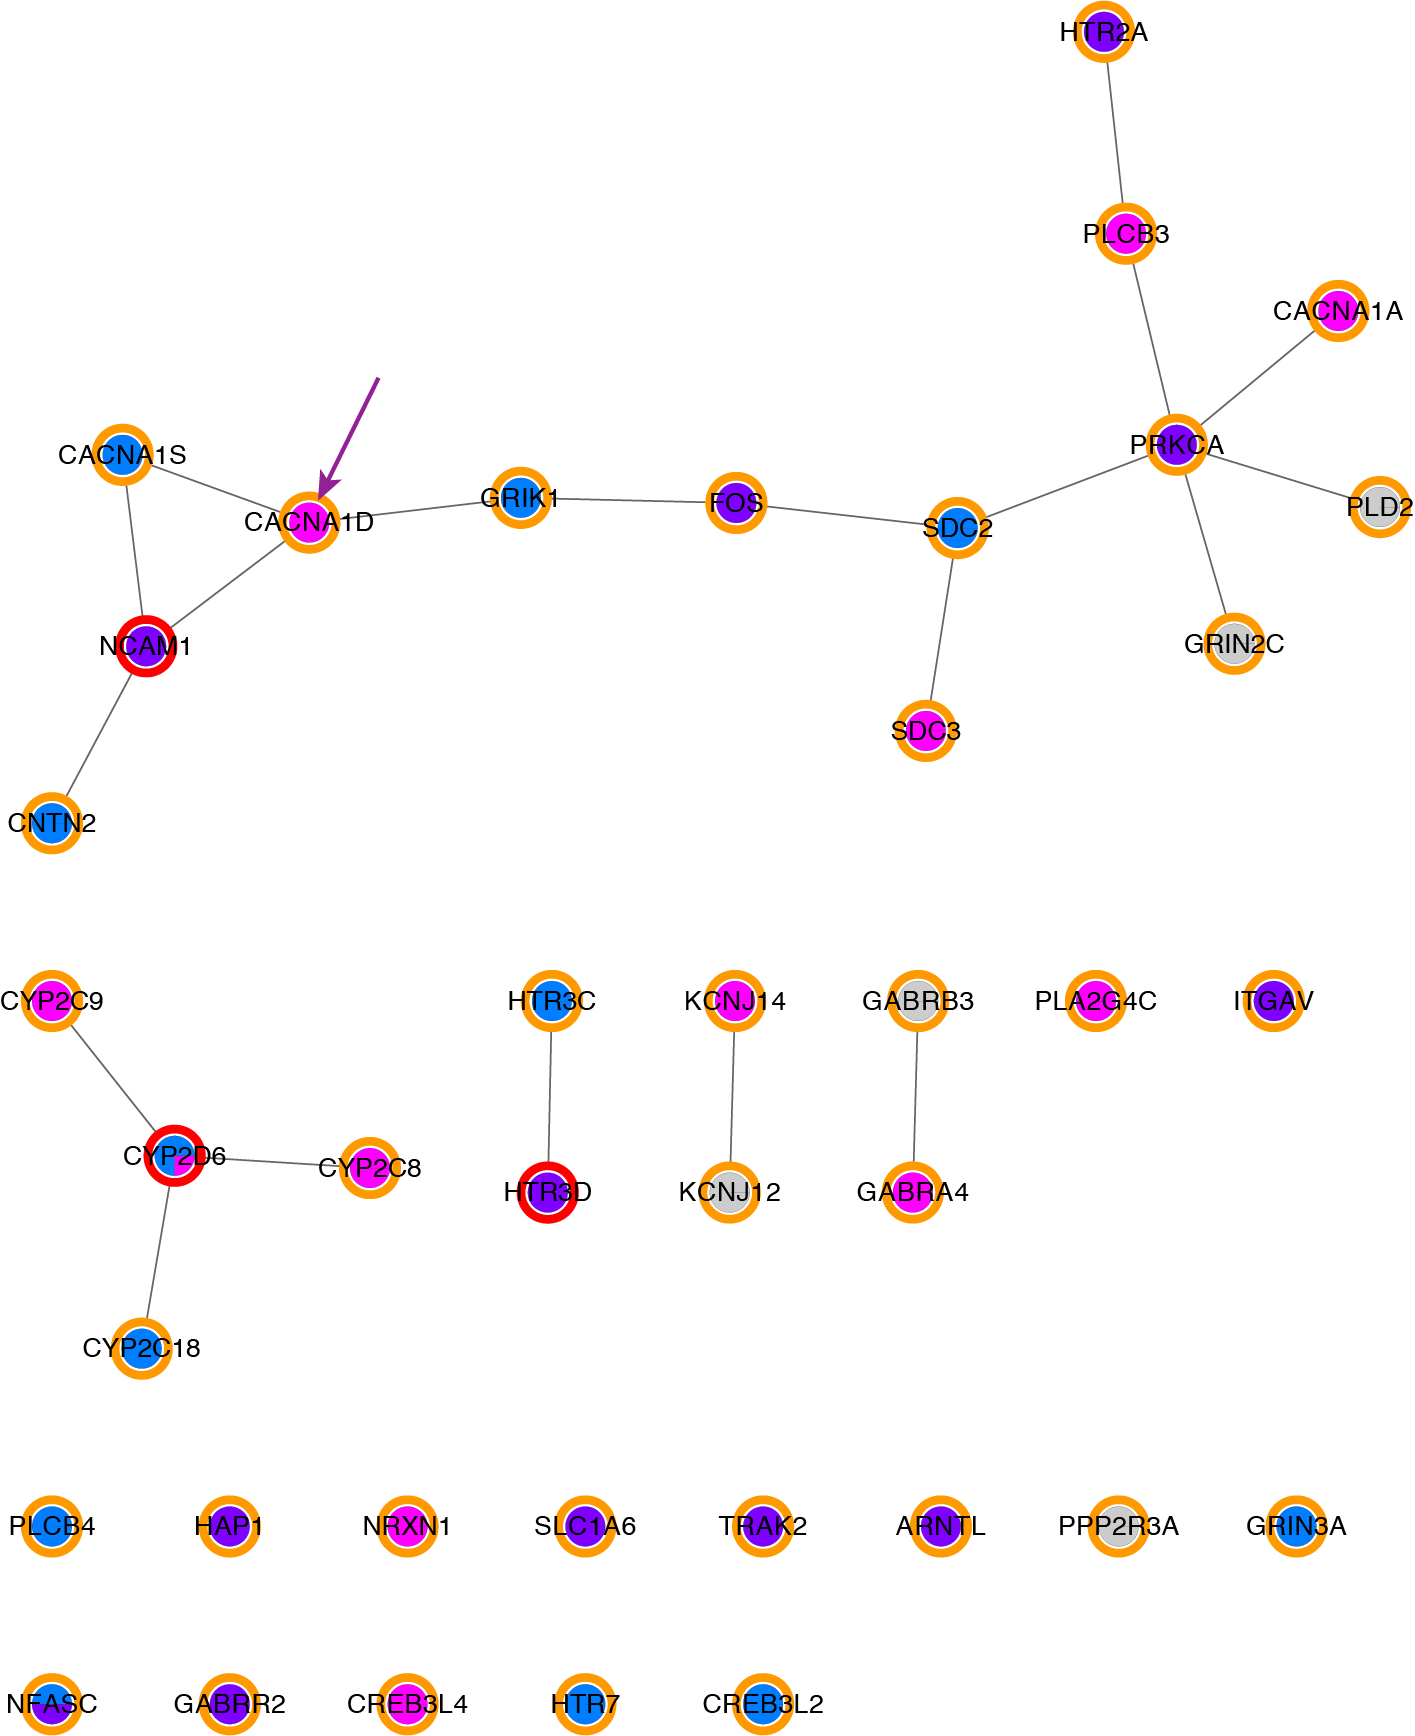
Select CACNA1D in the current network.
After selecting CACNA1D, in GRAVITY’s Results panel you will find information on this genes along with all the carried variants passing the current filters previously set-up.
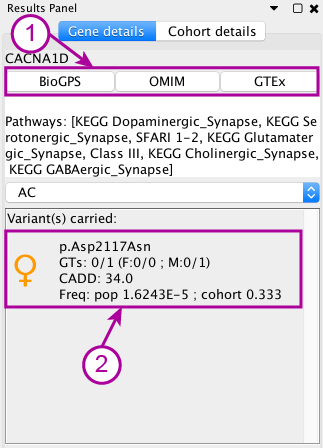
In the Gene details tab, the first highlighted part (1) contains quick links to useful websites to assess the importance of the gene. The second highlighted part (2) contains the list of carried variants. In this case the variant a missense changing an aspartic acid to an asparagine (p.Asp2117Asn), it is inherited from the mother, its CADD score is 34 and the frequence in gnomAD is 1.6243E-5.
If you want to learn more about filtering, or displayed information in the Result’s panels, you can go read the section specific to respectively the Controls or the Results.